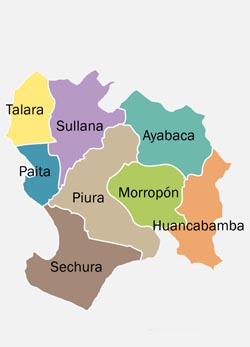
Piura
-
SEGURO INTEGRAL DE SALUD Total de atenciones a PAM 126,969Hombres 50,346Mujeres 76,623Total de PAM afiliados: 102,320Hombres 50,960Mujeres 51,360MINISTERIO DE SALUD Total de PAM atendidos 51,534Total de atenciones a PAM 262,466MINISTERIO DE LA MUJER N° de CIAM (Provincial), 2015 2N° de CIAM (Distrital), 2015 8PAM afectadas por violencia familiar 54Hombres 9Mujeres 45PAM afectadas por violencia sexual 2INSTITUTO NACIONAL PENINTENCIARIO PAM en establecimientos penitenciarios 85MINISTERIO DE JUSTICIA Y DERECHOS H. PAM atendidos en la Defensa Pública 1,642PODER JUDICIAL Violencia Familiar N° procesos iniciados 180N° procesos terminados 322MINISTERIO DE AGRICULTURA Y RIEGO Total de PAM agricultores 48,028MINISTERIO DE DESARROLLO E INCLUSIÓN N° adultos mayores beneficiados 34,211CONADIS Total de PAM con discapacidad 50,790
Estadísticas de PAM, 2015
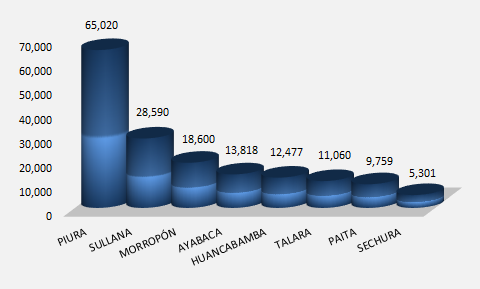
NÚMERO DE PERSONAS ADULTAS MAYORES POR PROVINCIA, 2015
El departamento de Piura cuenta con una población de1,844,129 habitantes, donde el 8.9% representa la población adulta mayor (164,625).
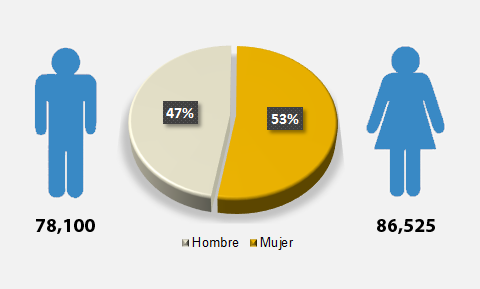
PERSONAS ADULTAS MAYORES POR SEXO, 2015
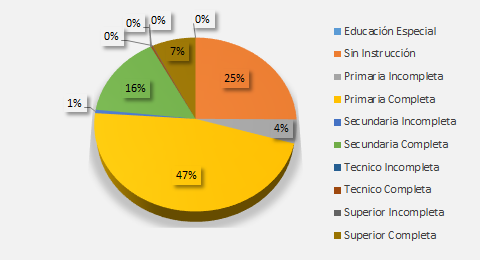
PORCENTAJE DE ADULTOS MAYORES POR NIVEL EDUCATIVO, 2013
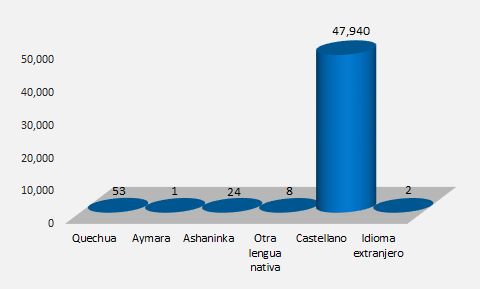
AGRICULTORES DE 60 Y MÁS AÑOS DE EDAD POR IDIOMA, 2012
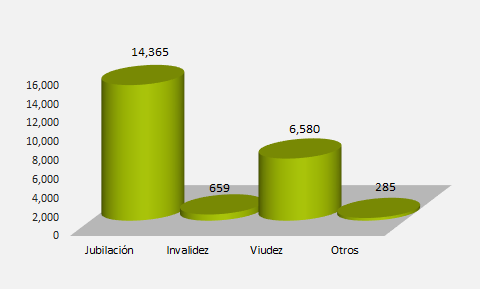
PERSONAS ADULTAS MAYORES POR TIPO DE PENSIÓN, 2014
PERSONAS ADULTAS MAYORES POR GRUPOS DE EDAD, 2015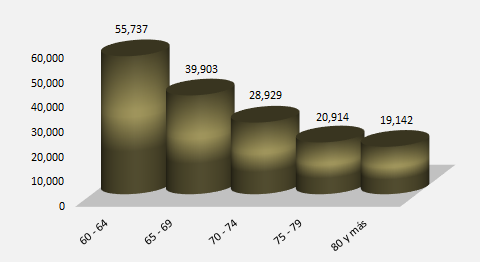
NÚMERO DE PERSONAS ADULTAS MAYORES POR DISTRITO, 2015
El departamento de Piura cuenta con 64 distritos.Descargar
Fuente: INEI - Estimaciones y Proyecciones.
 Facebook
 Flickr